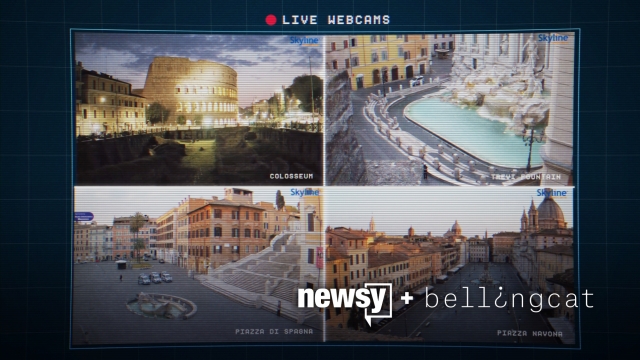
These are live webcams showing what are typically some of the world's busiest places. But now? They're ghost towns. This is the effect of the coronavirus and it's visible all over the world.
With more than a million total cases, the coronavirus is a global disaster. It's led to countries declaring stay-at-home orders keeping people at home in order to stop the virus from spreading further.
Turns out, you can actually get a look at all of this while stuck at home by using open-source tools. From tracking airplanes in the sky to foot-traffic analytics from Google -- there are many ways to see what it looks like when the world is forced to grind to a halt. This video will show you how.
Traffic is one of the ways to look at how starkly things have changed with cities and nations implementing varying degrees of social distancing measures.
Roads in places with typically notorious traffic like Los Angeles have simply... cleared up. This can be seen in both live traffic cameras and live traffic trackers -- both of which show LA's highways are much more empty than usual.
Perhaps unsurprisingly, this has led to a drastic cut in accidents throughout the state of California. It's also led to three straight weeks of cleaner air quality than normal in southern California.
It's not just the roads, either -- air traffic has also started to disappear. Tracking sites like FlightRadar24 show a massive drop in numbers of commercial flights tracked in the air starting around mid-March. Using the site's 7-day average, there are over 100,000 fewer planes being tracked now than there were at the beginning of March.
It's even more visible when looking at the site's live map where Europe, typically swarming with flights, is mostly quiet. The same can't be said about the U.S. quite yet, although there has been a drop.
Another site, RadarBox, shows how individual airports have been affected. New York City's JFK airport has seen a 75 percent drop in its 7-day average measuring plane movement.
Another way to see how badly the airline industry has been hit by COVID-19 is by using satellite imagery. While not always the highest quality, the Sentinel program has near-daily imagery that can be used to observe changes at airports.
One example is the airport in Frankfurt, Germany where -- because of the slowdown in flights -- planes are being stored on runways that aren't being used. The same thing can be observed in Tulsa, Oklahoma.
While ground and air traffic are good ways to see the lack of movement between places — there are also ways to see how much foot traffic has decreased in cities. Typical tourist destinations like Rome have myriad live web cameras that show eerie stillness compared to what could be seen before the outbreak.
Hobbyist drone videos from places like YouTube or social media illustrate a similar point. A more abstract way to see this is using Google's Community Mobility Reports -- anonymized and aggregated data collected by Google Maps. Using these, you can see just how much peoples' movements have changed since the outbreak.
Comparing the US against Germany shows a wide gap between how both nations have responded to the outbreak. Whereas retail and recreation movement in the states has dropped by about 47 percent, it's fallen by 77 percent in Germany.
All of this adds up to show just how drastically different parts of society have been changed by the COVID-19 outbreak.
But there's still a silver lining to be seen here -- with all of this data and evidence showing that people really are staying home, it means social distancing measures are generally being observed, something public health experts say has to happen to stop the spread of coronavirus.
This video is part of a collaboration between Newsy and Bellingcat.


